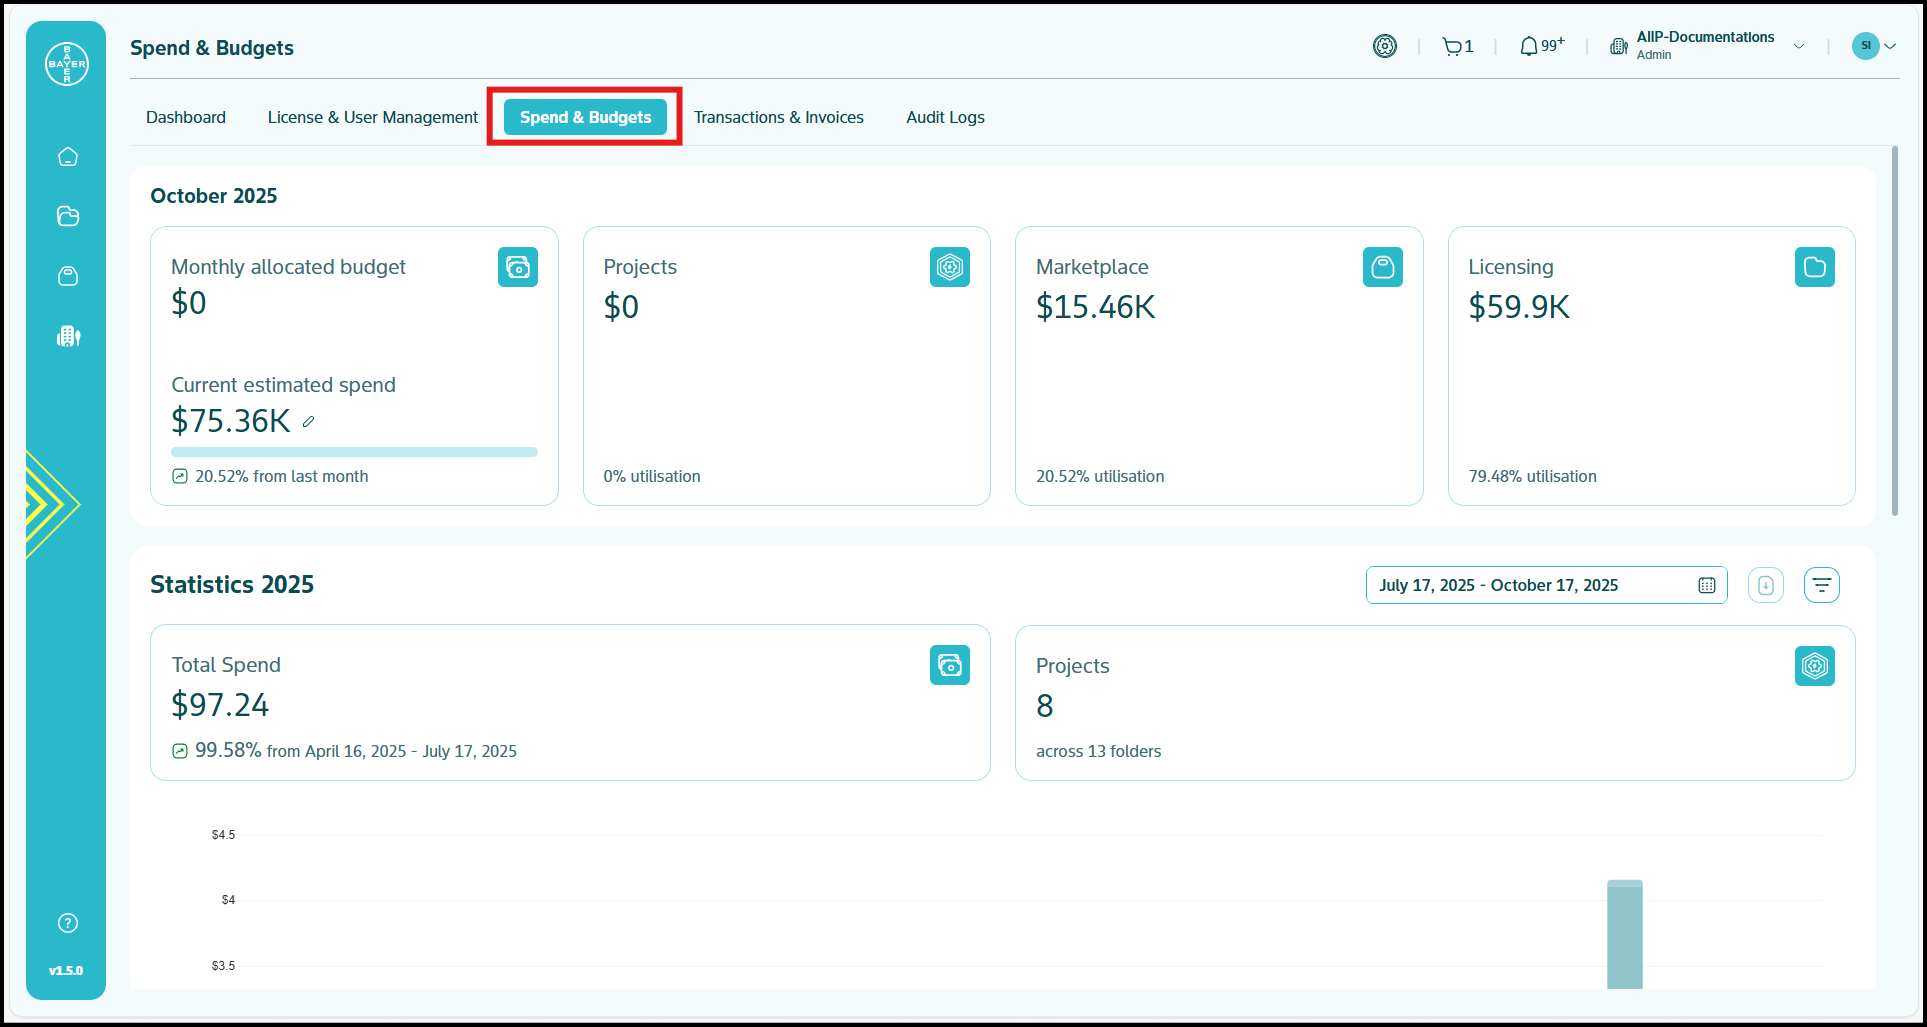
Spend and Budgets
The Spend & Budgets section provides comprehensive financial oversight of your tenant's resource consumption across all platform services. This powerful Dashboard offers real-time visibility into your spending patterns, budget utilization, and resource allocation, enabling you to make informed decisions about your cloud investments.
Monthly Financial Summary (Coming Soon)
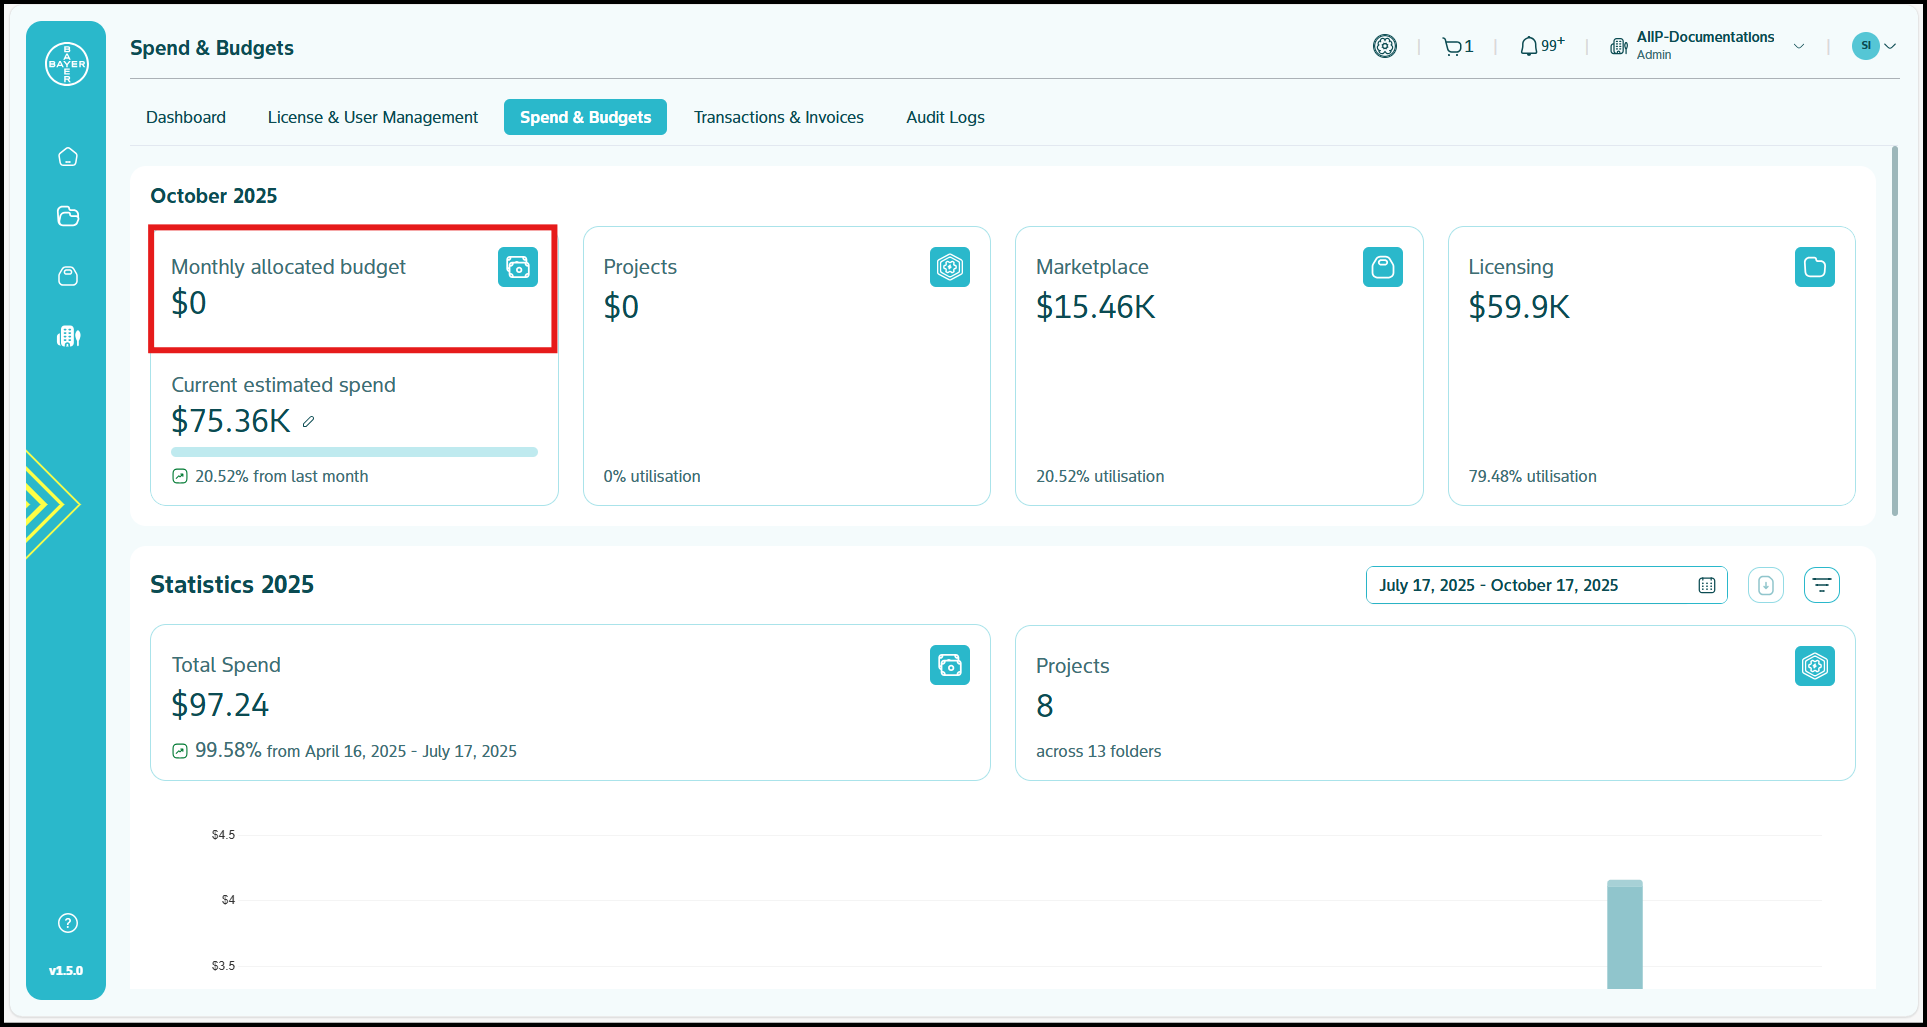
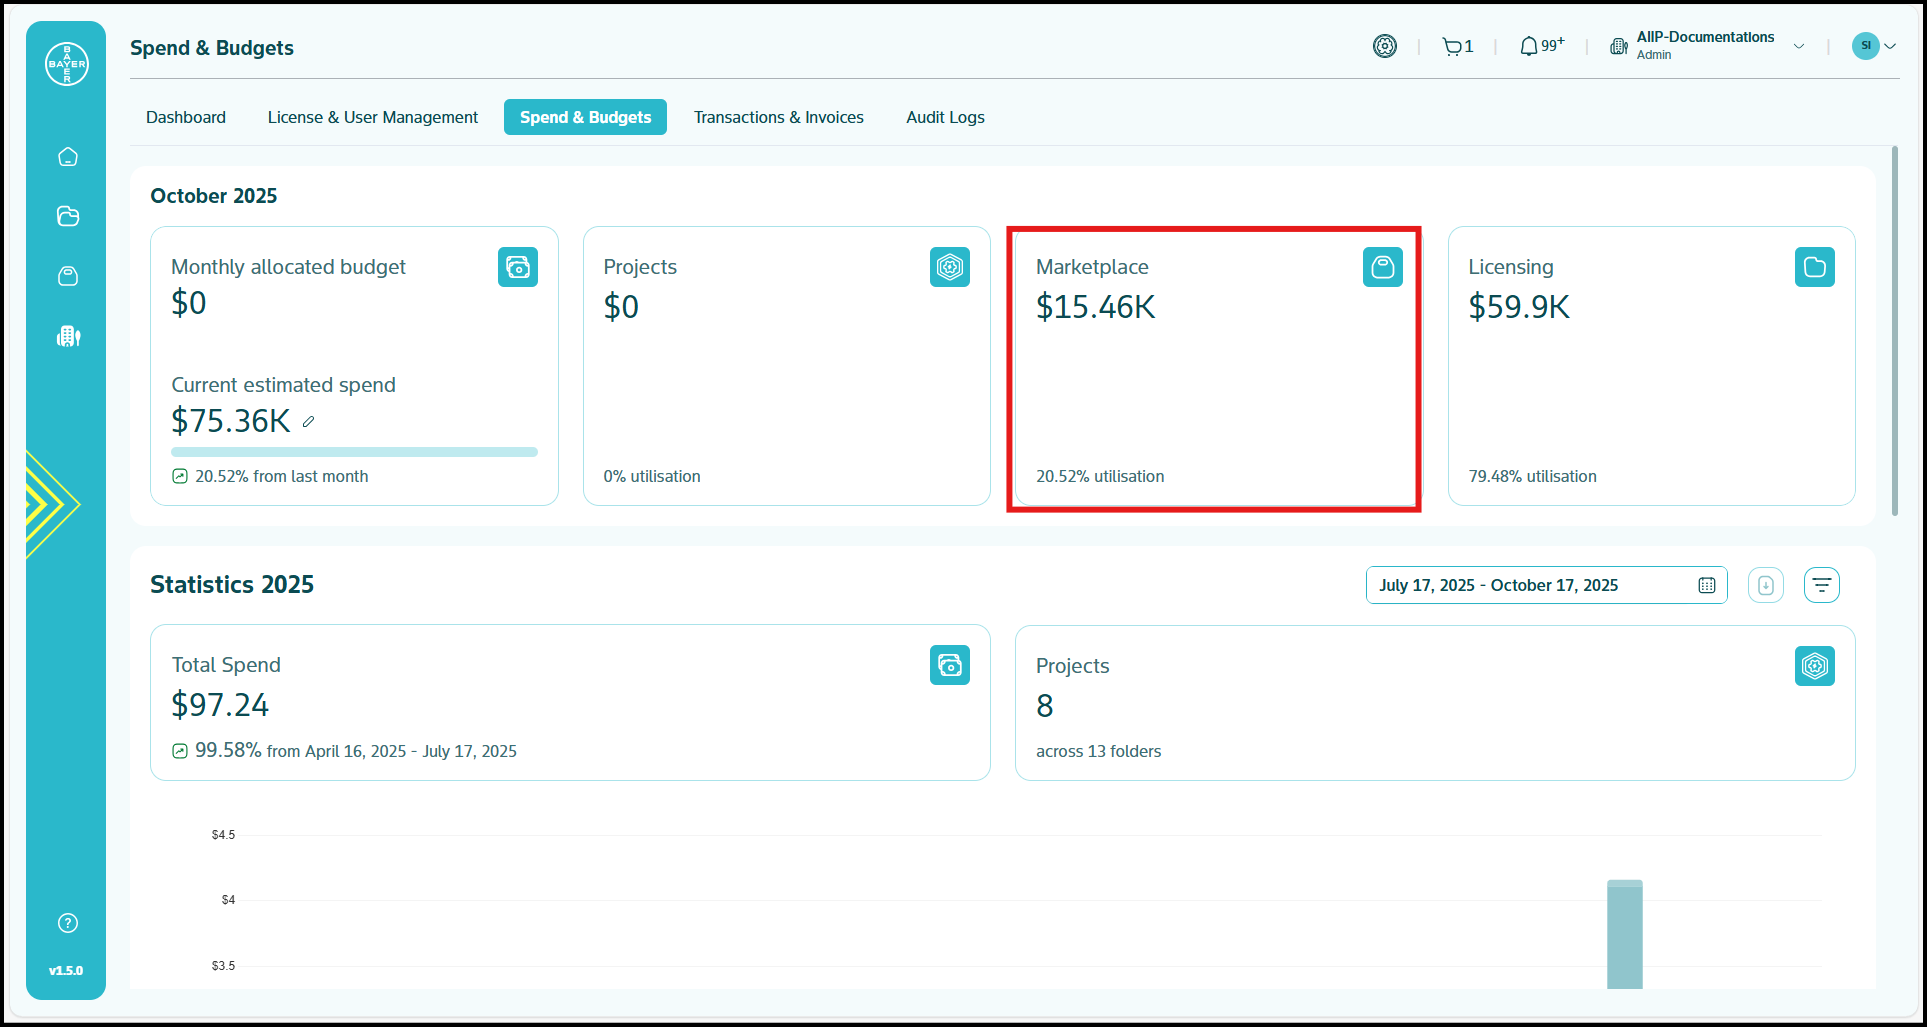
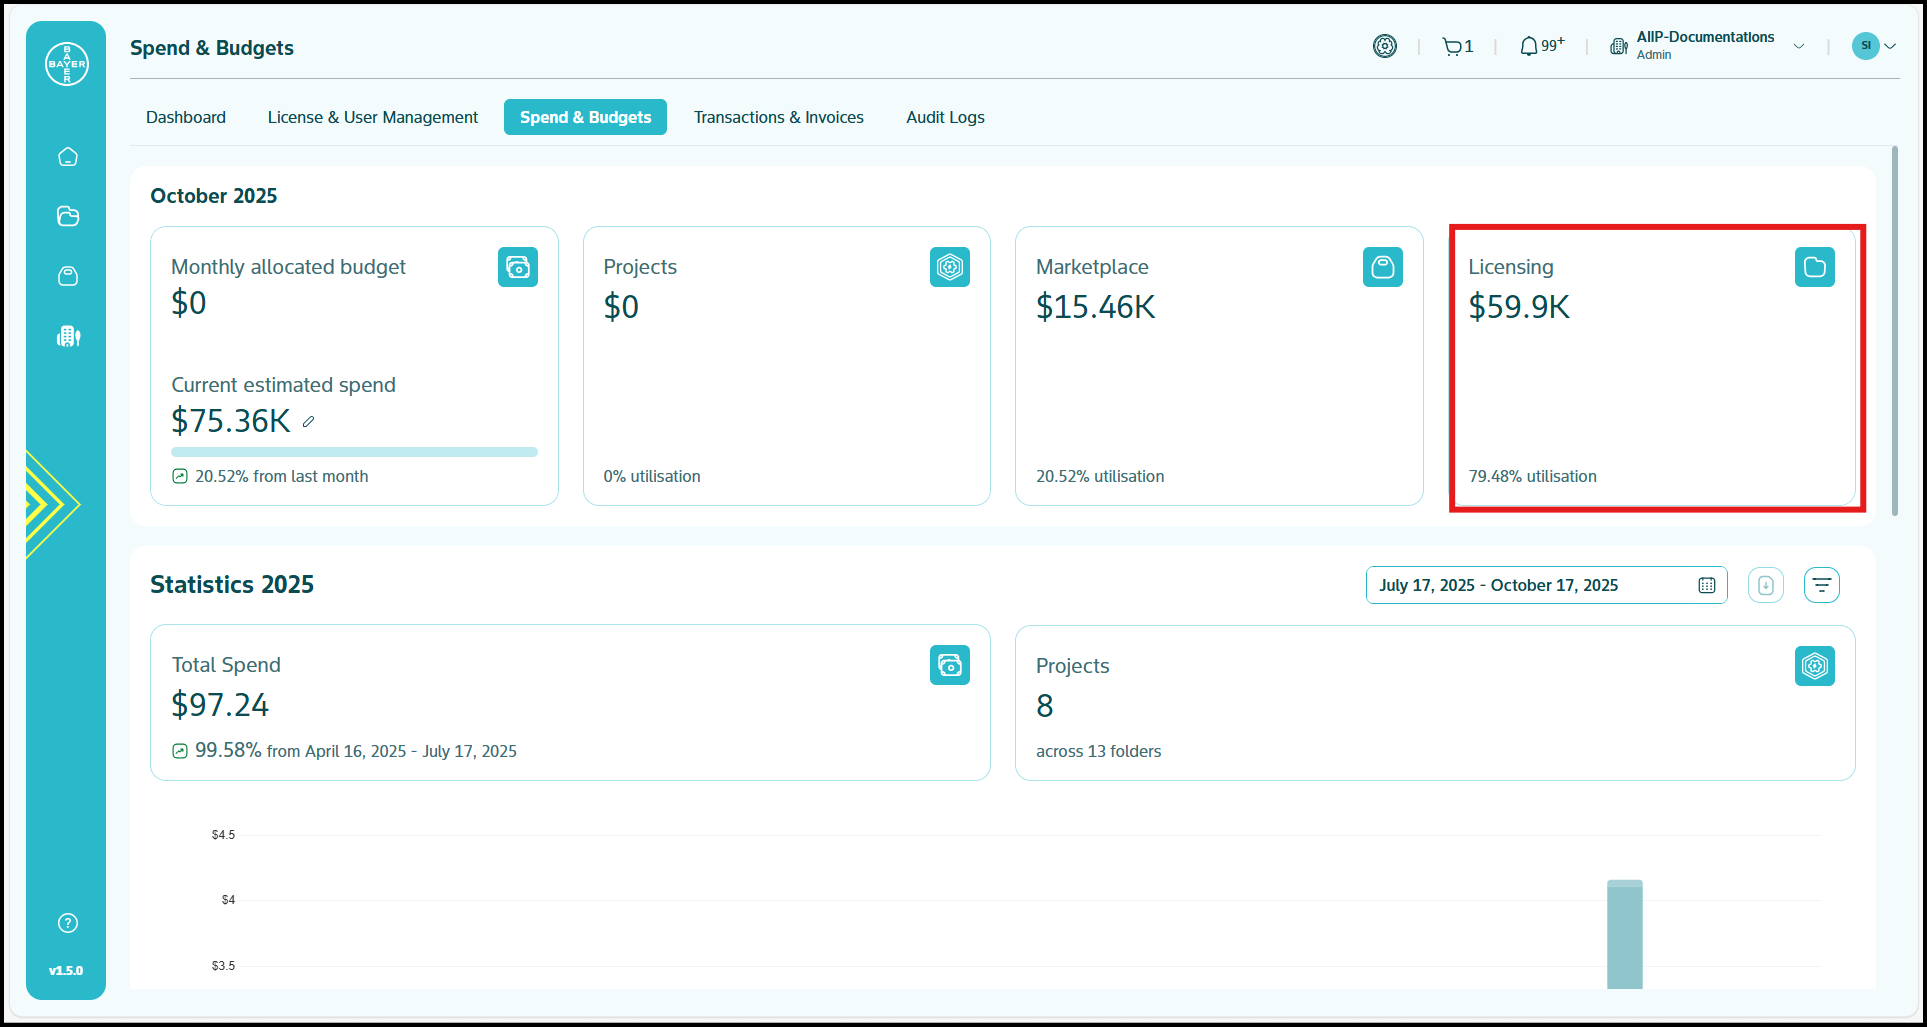
The top section of your Dashboard displays your current month's financial status through four integrated information cards:
-
Monthly Allocated Budget
- Your total authorized spending amount for the current month
- Serves as the baseline for all utilization calculations
-
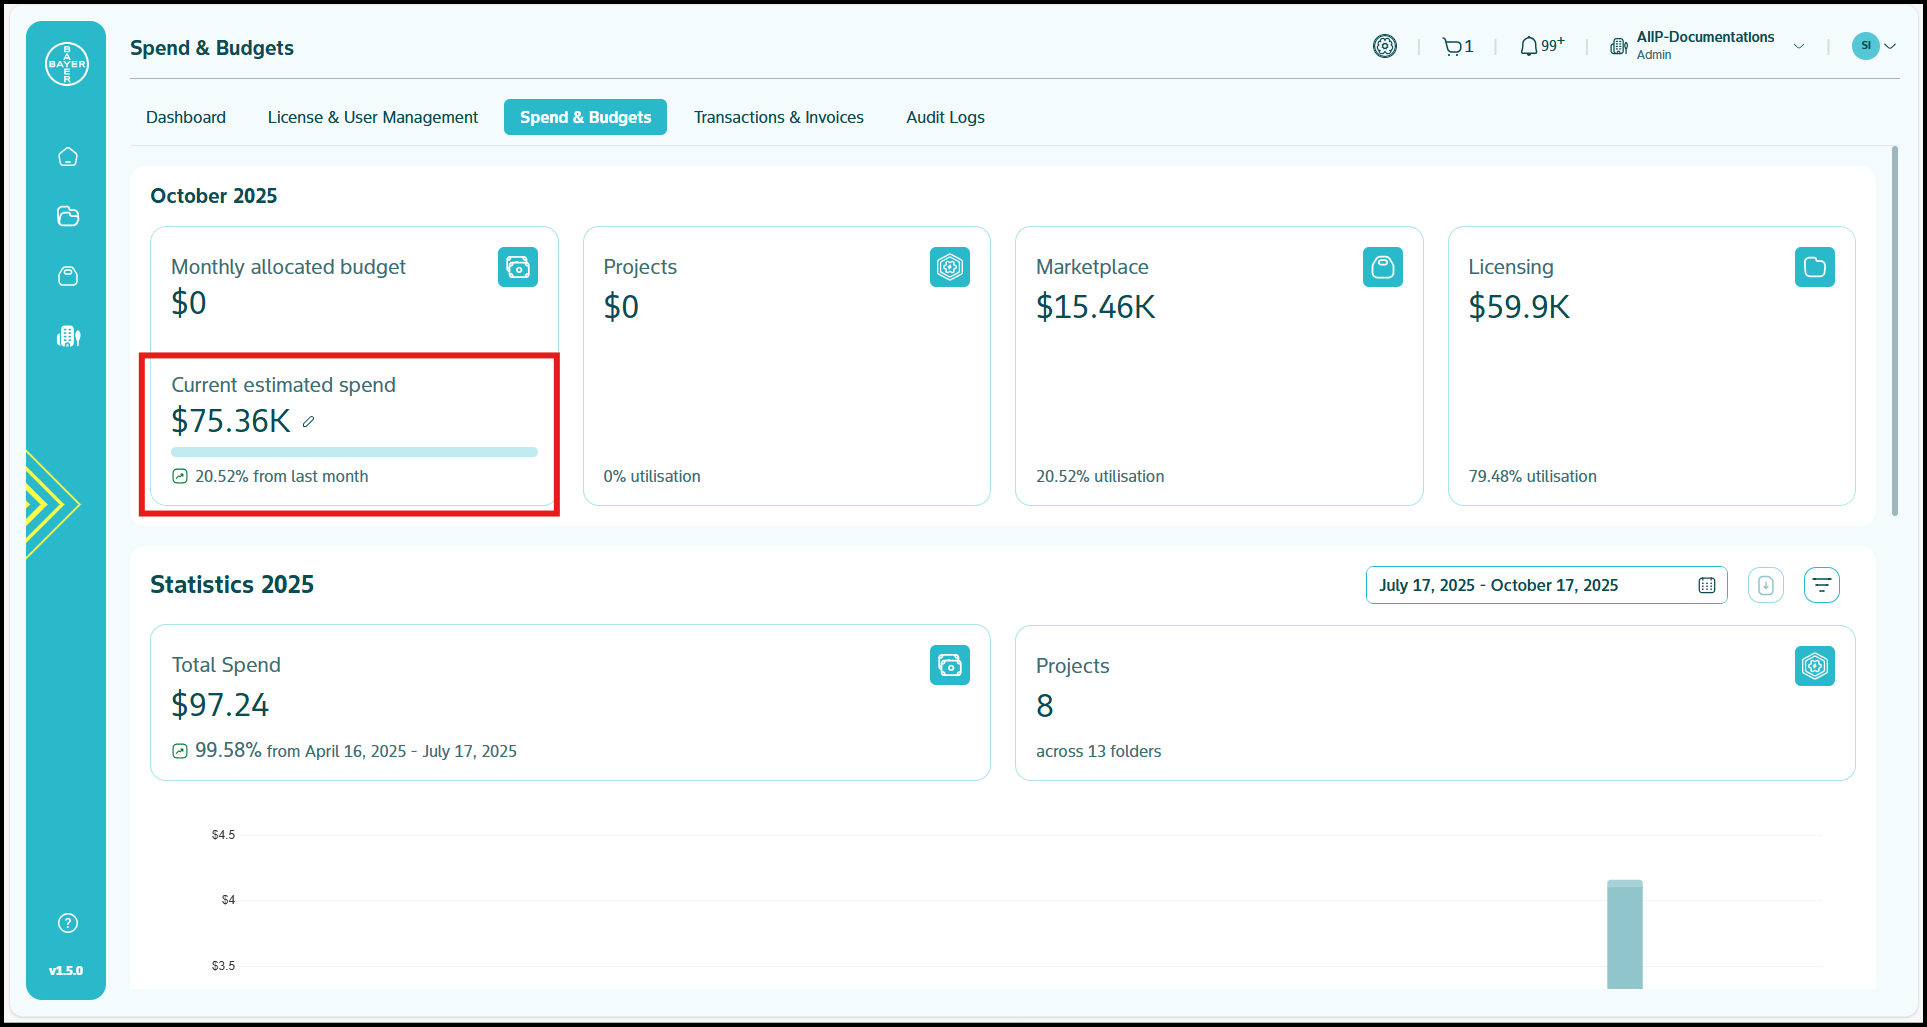
Current Estimated Spend
- Running total of your month-to-date expenditure
- Percentage comparison to previous month's spending
-
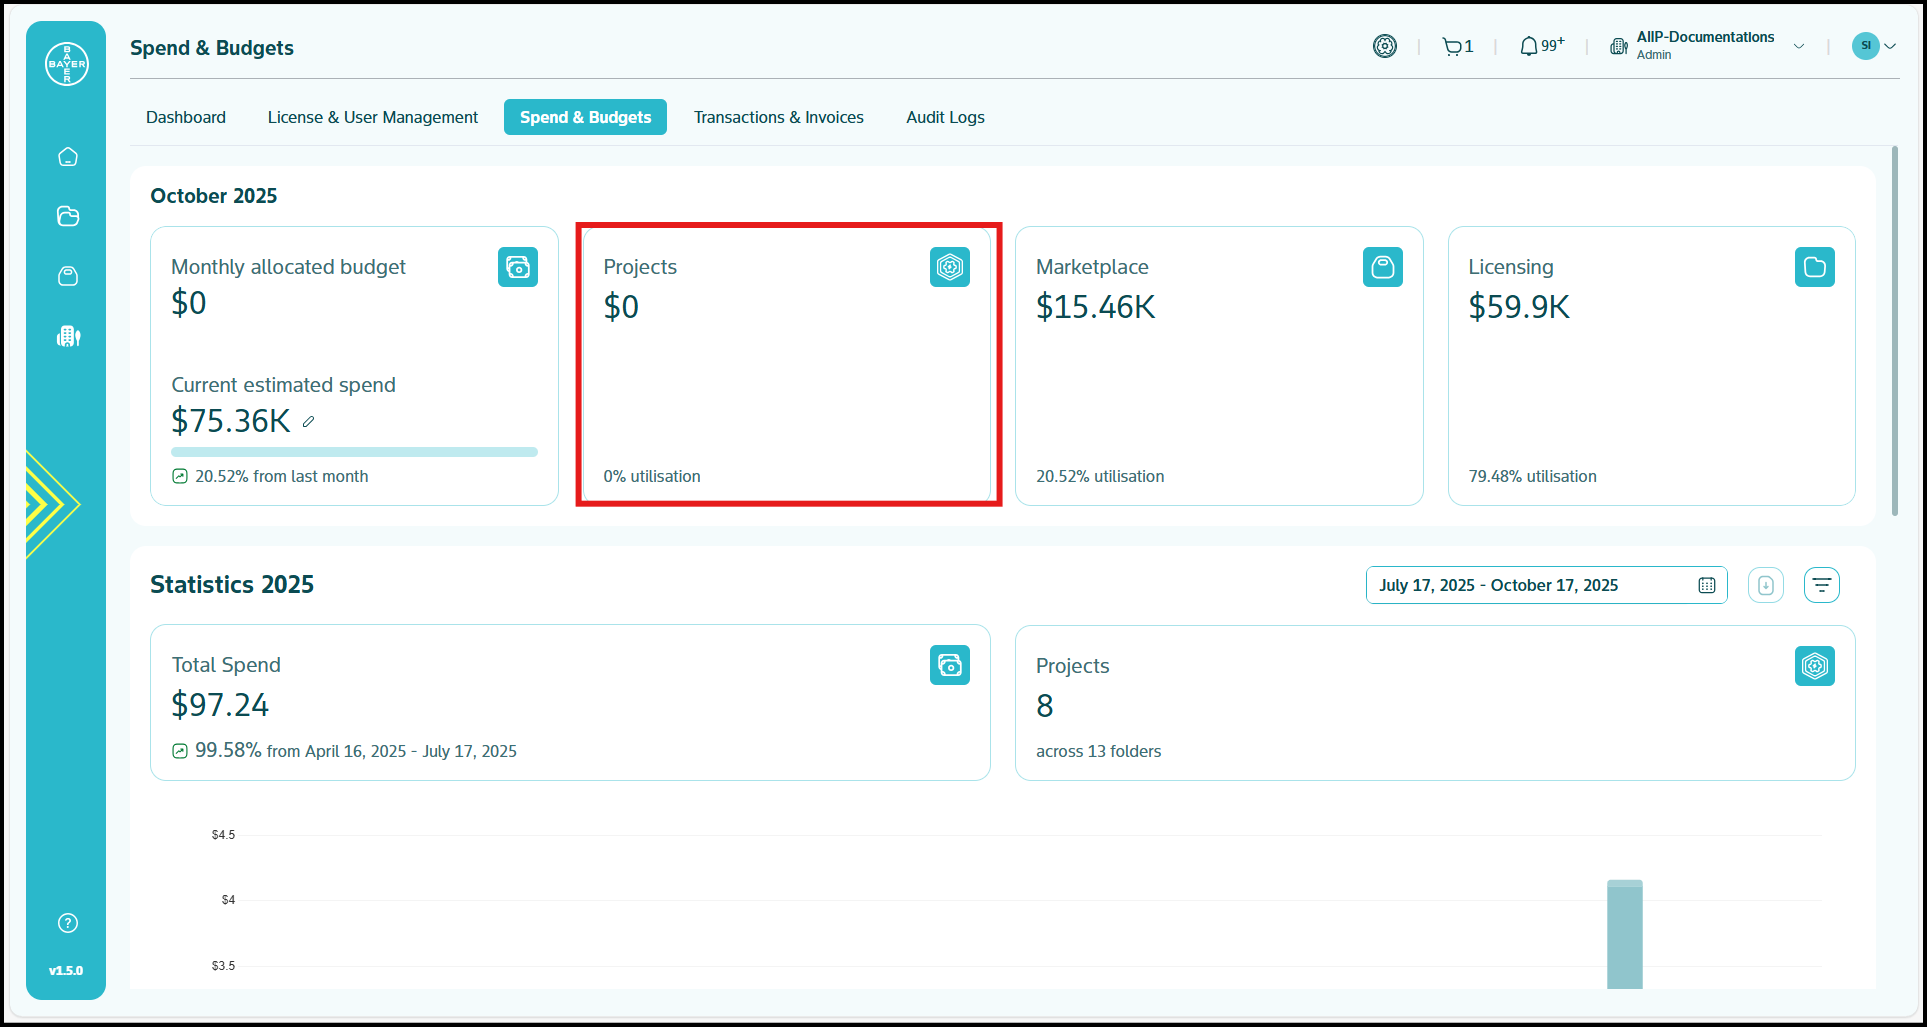
Category-Specific Spending
Each card provides spending information and utilization percentages for projects, related to all the cloud project expenditures
Project Budget Controls for Admins
Admin Capabilities:
Admins can implement two types of budget controls for projects across their tenant:
Soft Budgets
Soft budgets provide spending visibility without service disruption:
- You and your users receive notifications at 80%, 90%, 95% and 100% of budget consumption
- Services continue running even when budgets are exceeded
- Ideal for production environments and business-critical workloads
- Users will be prompted to contact admins about budget adjustments
Hard Budgets (Coming Soon)
Hard budgets enforce strict spending limits for greater financial control:
- You receive the same notification thresholds at 80%, 90%, and 100% of budget consumption
- When budget is fully consumed, compute services are automatically suspended and no new services provisioning is possible
- Services remain suspended until you increase the budget or the budget refreshes
- Perfect for development/test environments or controlling costs for specific resource-intensive services
Historical Analysis Tools
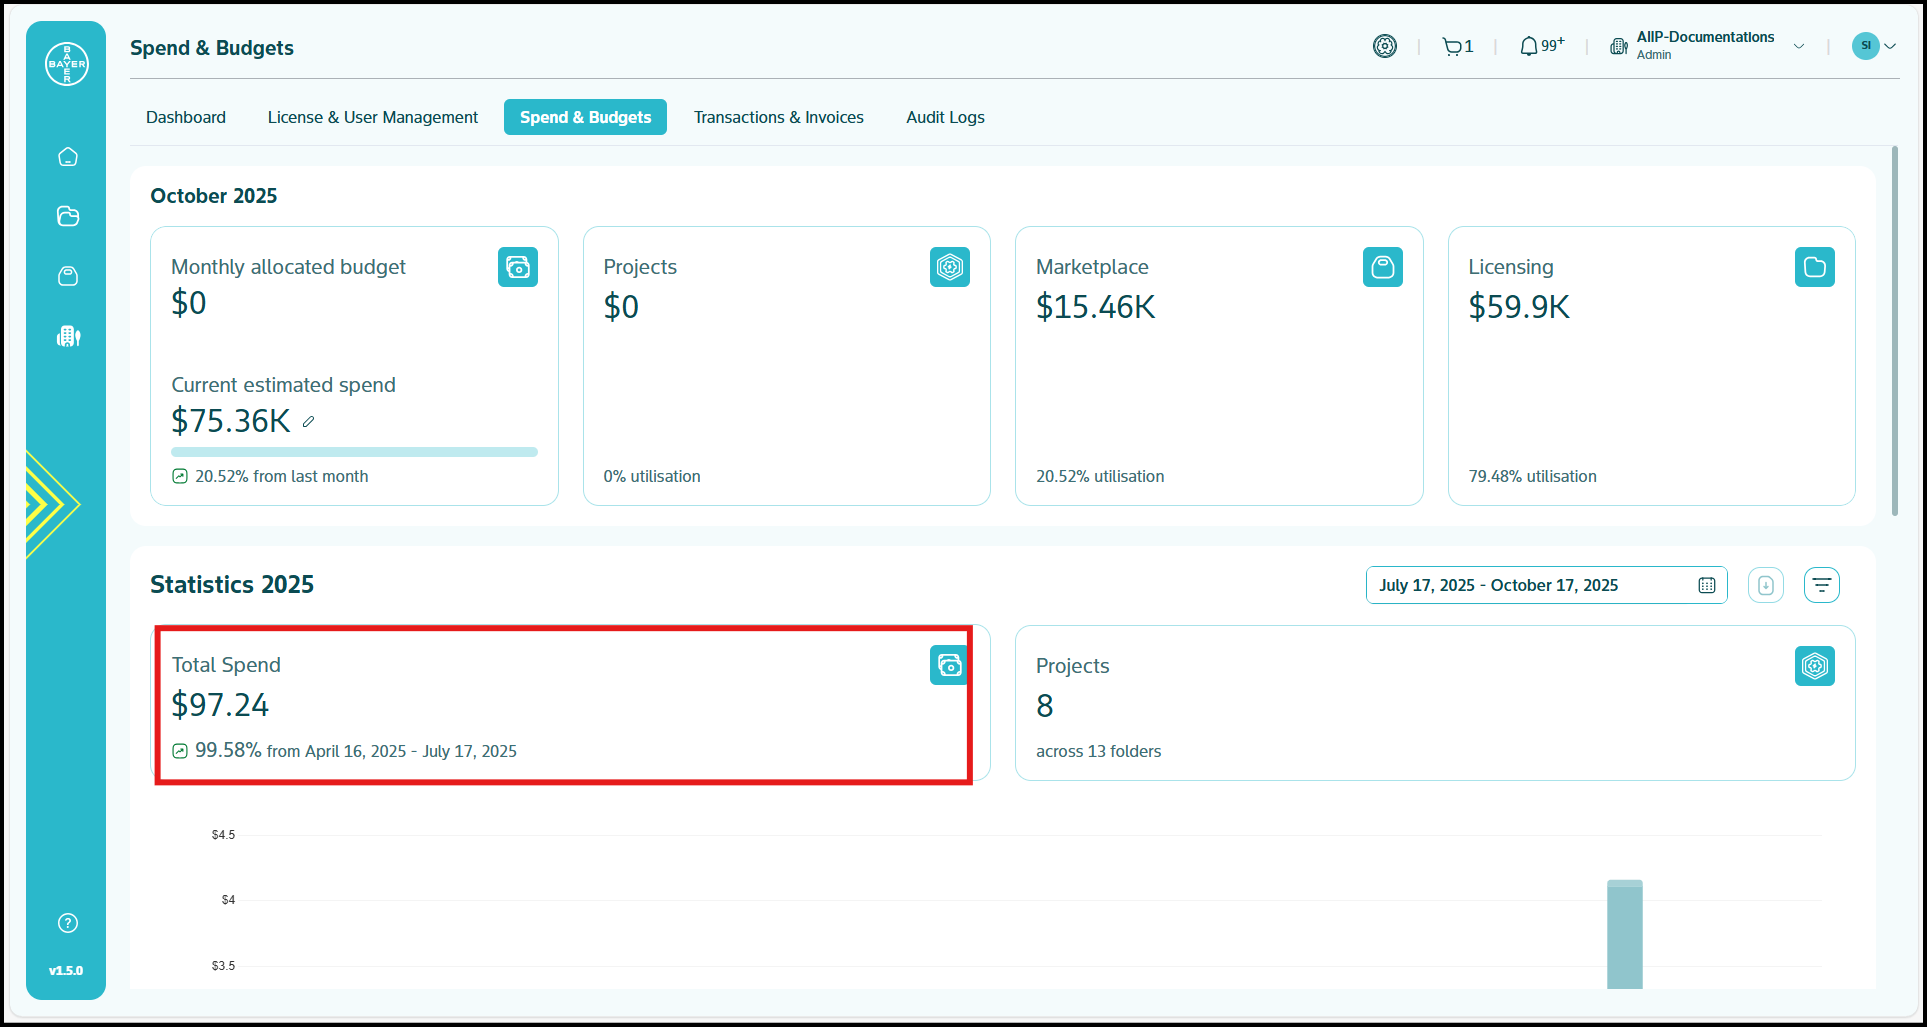
The Statistics section delivers deeper insights into your spending patterns over customizable time periods.
-
Total Spend Analytics
- Comprehensive expenditure figures across your selected timeframes
- Percentage changes compared to previous periods
-
Project Distribution
- Your active project counts and tenant folder distribution
- Resource allocation patterns
- Project growth trends
-
Visual Data Representation of Cost Reports
- Automatic chart generation once sufficient cost data is available
- Trend visualization across multiple time intervals
- Increasingly valuable insights as your platform usage continues
Note
The Spends and Budget section displays cost data fetched from GCP, which is updated with a delay of up to three days.
Customization for Tailoring Your Financial View
You can customize the Spend & Budgets Dashboard to focus on your specific analysis needs:
-
Adjustable Date Ranges: Select predefined periods or create custom timeframes using the date selector in the upper right corner
-
Budget Notification System: Receive proactive alerts when your spending reaches 80%, 90%, 95% and 100% thresholds, with separate notifications for each spending category
-
Statistical Filters: Refine your data view using category, project, and resource-type filters to identify specific spending patterns
-
Export Capabilities: (Coming Soon) Download your statistics in multiple formats (CSV, PDF, Excel) for offline analysis and reporting
Recommended Best Practices
To maximize the value of your Spend & Budgets Dashboard:
- Review your financial data weekly to identify emerging trends
- Compare your current spending with historical patterns to detect anomalies
- Monitor the balance between your project expenditures
- Address spending trends proactively before reaching budget limits
- Share relevant insights with project stakeholders to align on priorities
The Spend & Budgets Dashboard equips you with the financial visibility needed to optimize your cloud investments while maintaining effective control over your tenant's expenditures.