Publisher Dashboard
The Publishing Center Dashboard functions as a dynamic and insightful interface, offering you a quick and comprehensive overview of your publishing activities and the performance metrics of your items. Remember, this Publishing Center can only be accessed if you have the add-on Publisher license purchased for your tenant and the Publisher seat assigned to you.
For New Users
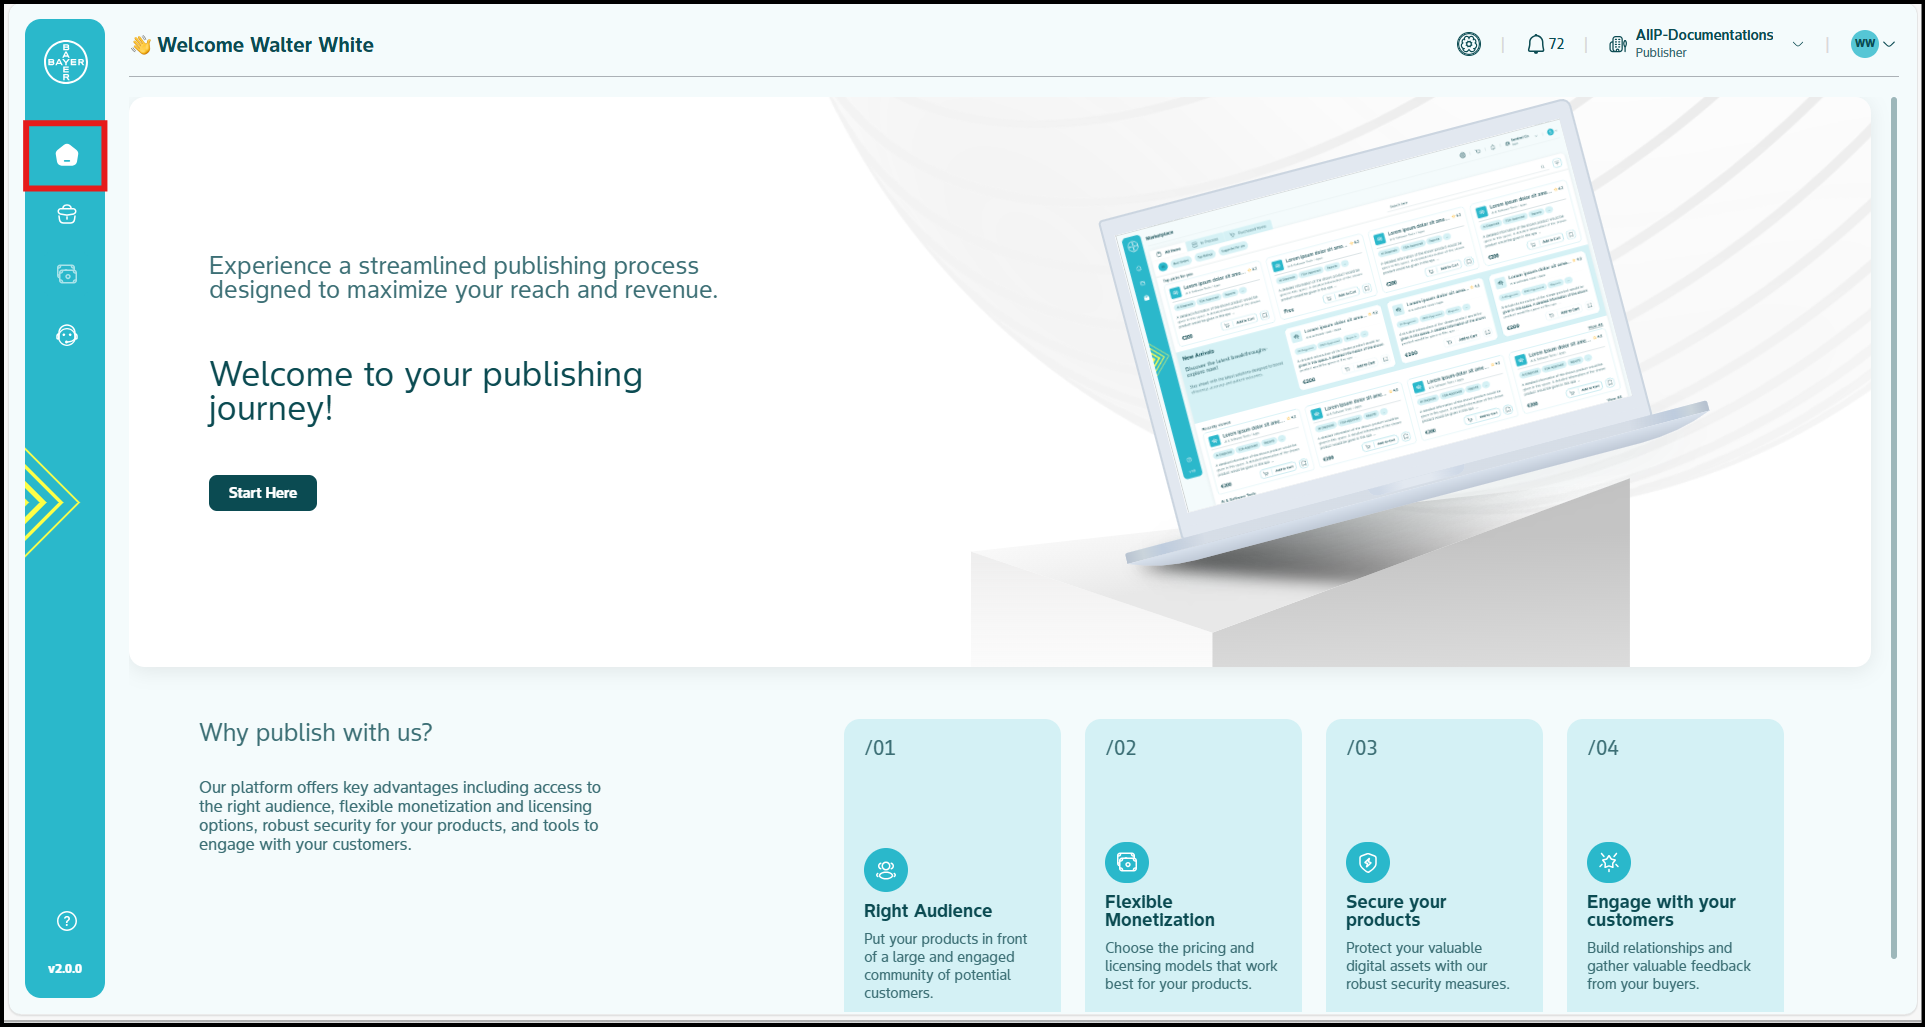
Upon your initial access to the Publishing Center and prior to publishing any items, you will encounter a quick start guide prominently displayed on your dashboard. This guide is designed to facilitate your initial steps in publishing your first item. You can simply click the "Start Here" button to commence your publishing journey. In this initial state, your dashboard presents a simplified view, without performance analytics until you publish items. Click here for more details.
For Experienced Users
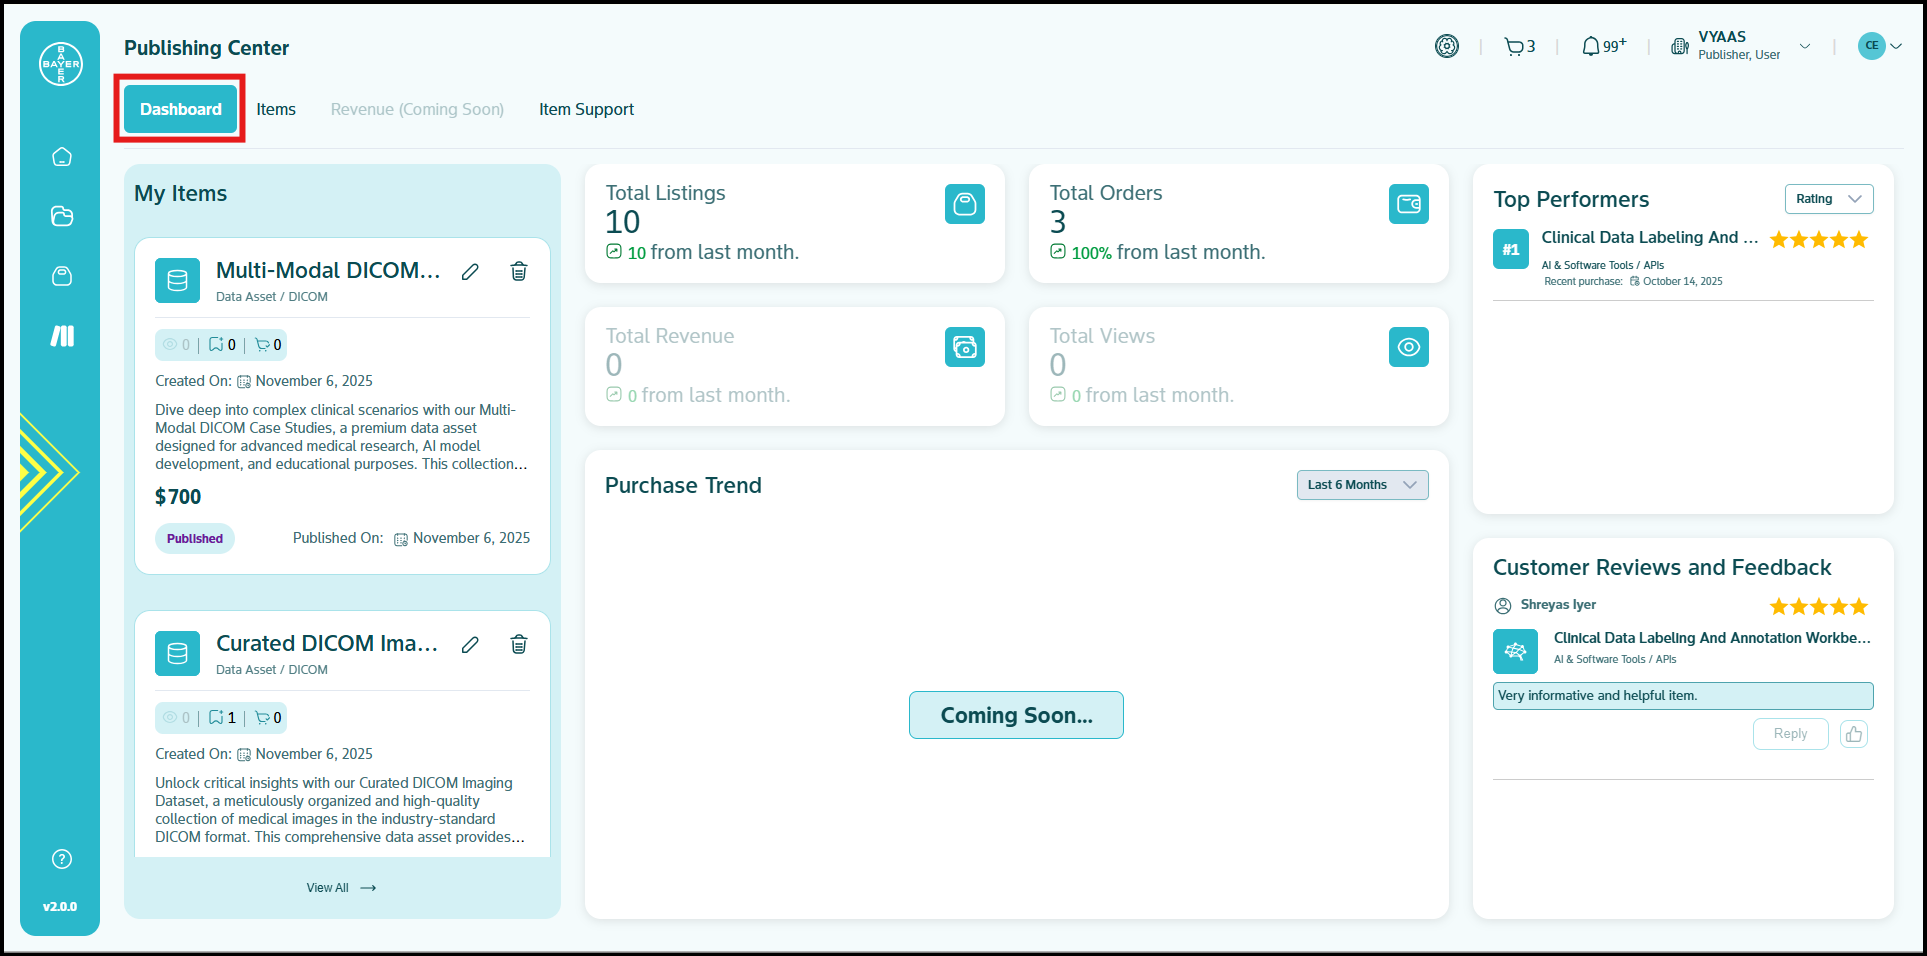
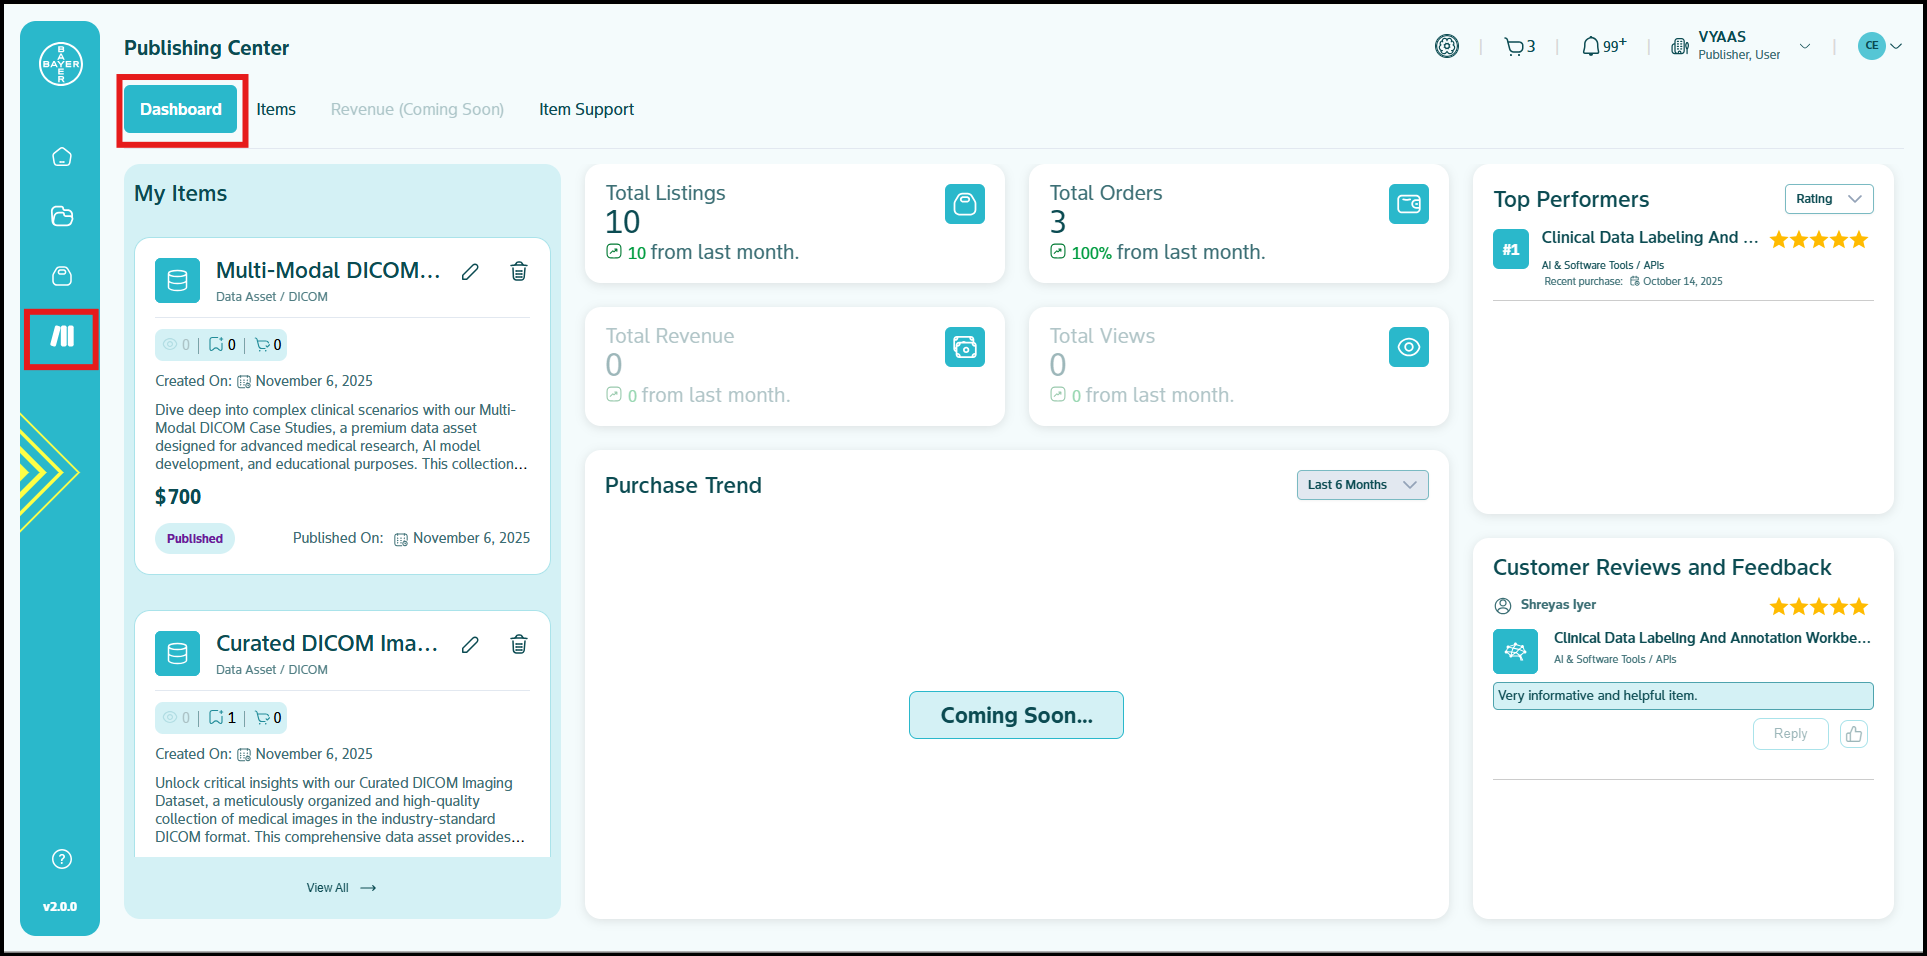
Once you have published items, your dashboard transforms into a powerful analytics hub, presenting key metrics and performance trends.
-
My Items: This section provides you with a readily accessible list of all the items you have successfully published.
-
Total Listings: This card displays the cumulative number of items you have published. It also includes a metric indicating the percentage increase or decrease in your listings when compared to the preceding month, offering insight into your publishing activity trends.
-
Total Orders: You can track the total number of orders received for your items. This card presents the percentage change in orders from the previous month, highlighting your sales performance fluctuations.
-
Total Revenue (Coming Soon): This metric shows the total revenue you have generated from all your items within the Marketplace. The card also indicates the percentage increase or decrease in your revenue compared to the previous month, providing you with a clear financial performance indicator.
-
Total Views (Coming Soon): You can see the total number of times your items have been viewed by other users. This card displays the percentage change in views from the previous month, offering you insight into the visibility and reach of your items.
-
Purchase Trend (Coming Soon): This feature will provide you with a visual representation of your purchase trends. You will have the option to filter this data by selectable time frames such as the past 1 month, 3 months, or 6 months enabling flexible analysis of your sales patterns.
-
Top Performers: This dedicated section highlights your most successful items. You can filter this section to identify:
- Top Rated Items: Items that have received the highest average customer ratings.
- Top Earning Items: Items that have generated the most significant revenue for you.
-
Customer Reviews and Feedback: A summary section provides you with an overview of the reviews and ratings that your items have collectively received from customers, offering you a quick gauge of overall customer satisfaction.
Analytics on Individual Items
Within the "My Items" list displayed on your dashboard, you can access key performance analytics for each individual published item.
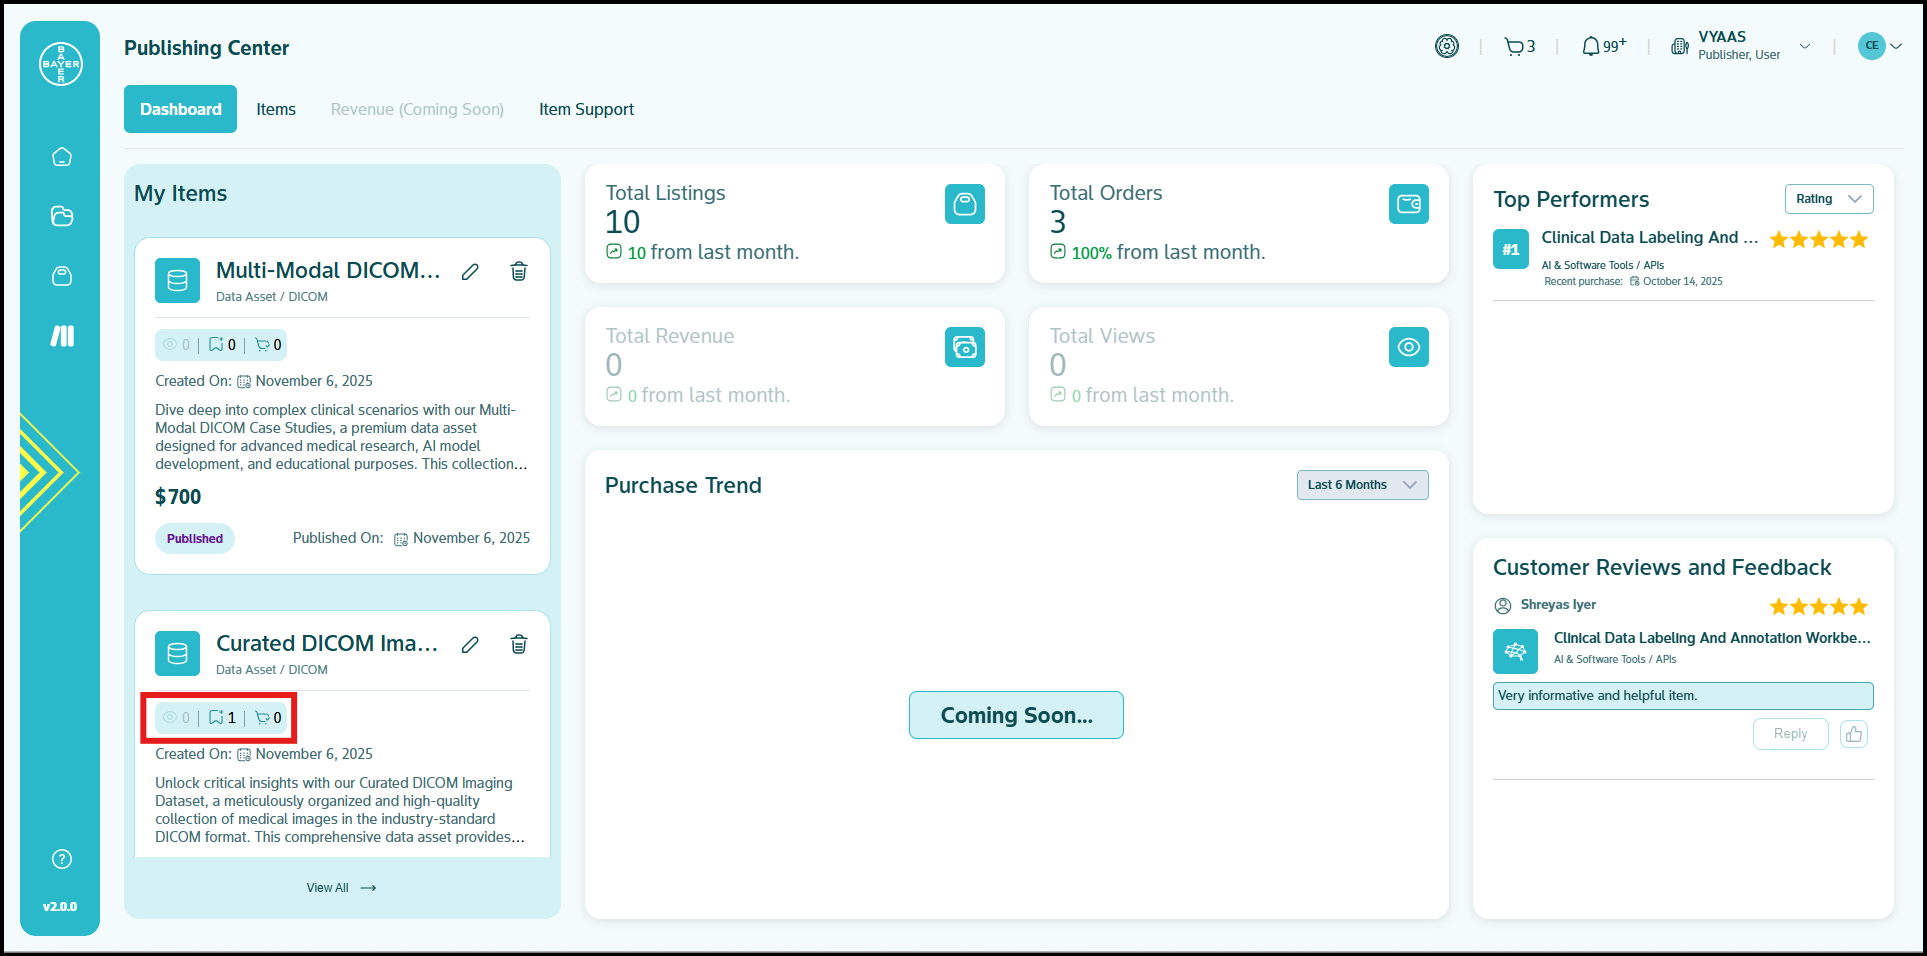
- Views: An eye icon accompanies each item, displaying the specific number of users who have viewed that particular item.
- No of Wishlists: A wishlist icon indicates the number of times your item has been wishlisted. This metric shows how many users have added your item to their wishlist.
- Purchases: This metric displays the precise number of users who have successfully purchased your individual item.
Your dashboard serves as a central point for you to gain a comprehensive understanding of your publishing success, enabling you to quickly assess performance, identify trends, and make informed decisions regarding your items.